Counting Queries per Request with Hibernate and Spring
Hibernate is a powerful ORM tool, no doubt about it. In projects using Hibernate, it can sometimes become easy to forget that underneath it there are actual SQL queries being executed, sometimes many of them, and sometimes, well, too many. As you navigate the object graphs of your entities and admire collections being populated automagically, beware that if Hibernate's query generation is left unchecked, you can easily end up executing gazzilions of unnecessary SQL queries unknowingly (I've actually seen thousands(!!) of queries executed per page render). Fortunately, these situations can usually be easily avoided once they are detected. I'm going to present one idea how to keep query generation in check.
While there are many tools that can use JVM instrumentation to profile your app and likely tell you when, which and how many JPA/Hibernate/JDBC queries are being executed (JProfiler is my favorite), they need to hook up to JVM and are usually not "always on" as you develop. And you have to learn how to use them. To detect the common problem with excessive query generation though, a simple log line with the number of executed queries would suffice. Unfortunately, it seems that Spring MVC and Hibernate do not offer such a function out of the box (you could turn on query logging, but that will log each and every query and will soon become too verbose to follow).
In this article I will show you how to use a thing called Hibernate Interceptor to count executed queries per each web request in Spring MVC application that uses JPA and Hibernate as the persistence implementation.
We will start by creating a HandlerInterceptor implementation (Spring MVC's equivalent of a filter) that will intercept incoming requests and initialze the statistics counters. HandlerInterceptors allow us to execute logic before the request processing is passed to controllers, after controller handler finishes execution (but before the view is rendered) and after the request is processed. We will use the HandlerInterceptor to gather statistics about a request so let's call it RequestStatistcsInterceptor. Before action is handled over to the controllers, in the preHandle(...) method of the RequestStatistcsInterceptor we will initialize a query counter in the other important component - Hibernate Interceptor. Hibernate Interceptor allows us to intercept some of the Hibernate functions and the one that we're interested in is onPrepareStatement() - it will be called each time Hibernate prepares an SQL statement to be sent to the database. We will do our counting there. Since each request is executed in its own thread, we'll need to have a counter per thread rather than a global counter so our interceptor's (let's call it HibernateStatisticsInterceptor from now on) will have to be ThreadLocal. Since an ascii picture is worth a thousand of words, hereby I present the diagram of our intended setup:
    			Request
    			|
    			v
    			RequestStatisticsInterceptor#preHandle()
    				|
    				|------------------>HibernateStatisticsInterceptor#startCounter()
    				|                   :
    				v              (ThreadLocal Counter)
    				Controller          :                             ______
    				    |               :                            /      \
    				    |----Query 1---(+1)----------------------->  \______/
    				    |----Query 2---(+1)----------------------->  \      /
    				    ...             :                            \  DB  /
    				    |----Query N---(+1)----------------------->  \______/
    				    |               :
    			RequestStatisticsInterceptor#afterCompletion(...)
    				|                   :
    				|<---queryCount-----HibernateStatisticsInterceptor#getQueryCount()
    				|------------------>HibernateStatisticsInterceptor#clearCounter()
    				|
    				Log queryCount
    				|
    			|
    			V
    			Response
Ok, now that everthing is clear let's take a look at the code.
public class RequestStatisticsInterceptor implements AsyncHandlerInterceptor {

	private ThreadLocal<Long> time = new ThreadLocal<>();

	private static final Logger log = LoggerFactory.getLogger(RequestStatisticsInterceptor.class);

	@Autowired
	private HibernateStatisticsInterceptor statisticsInterceptor;

	@Override
	public boolean preHandle(HttpServletRequest request, HttpServletResponse response, Object handler) throws Exception {
		time.set(System.currentTimeMillis());
		statisticsInterceptor.startCounter();
		return true;
	}

	@Override
	public void postHandle(HttpServletRequest request, HttpServletResponse response, Object handler, ModelAndView modelAndView) throws Exception {
		Long queryCount = statisticsInterceptor.getQueryCount();
		modelAndView.addObject("_queryCount", queryCount);
	}

	@Override
	public void afterCompletion(HttpServletRequest request, HttpServletResponse response, Object handler, Exception ex) throws Exception {
		long duration = System.currentTimeMillis() - time.get();
		Long queryCount = statisticsInterceptor.getQueryCount();
		statisticsInterceptor.clearCounter();
		time.remove();
		log.info("[Time: {} ms] [Queries: {}] {} {}", duration, queryCount, request.getMethod(), request.getRequestURI());
	}

	@Override
	public void afterConcurrentHandlingStarted(HttpServletRequest request, HttpServletResponse response, Object handler) throws Exception {
		//concurrent handling cannot be supported here
		statisticsInterceptor.clearCounter();
		time.remove();
	}
}
As you may have noticed there are some additional things in here:
- We're also recording time (since we already have a stats interceptor, why not also record the execution time of each request - it's a useful stat).
- In postHandle we're adding query count to the model - while it's not stricly necessary, it allows us to print query counts on the actual page we're rendering while we're developing the application.
- We're implementing
AsyncHandlerInterceptorand basically ignoring async requests as we cannot use the above approach for async requests because request execution may happen in a different thread than the one that triggers the interceptor and hence we can't really useThreadLocalto store the counters.
public class HibernateStatisticsInterceptor extends EmptyInterceptor {

	private static final Logger log = LoggerFactory.getLogger(HibernateStatisticsInterceptor.class);

	private ThreadLocal<Long> queryCount = new ThreadLocal<>();

	public void startCounter() {
		queryCount.set(0l);
	}

	public Long getQueryCount() {
		return queryCount.get();
	}

	public void clearCounter() {
		queryCount.remove();
	}

	@Override
	public String onPrepareStatement(String sql) {
		Long count = queryCount.get();
		if (count != null) {
			queryCount.set(count + 1);
		}
		//log.info(sql);
		return super.onPrepareStatement(sql);
	}
}
Nothing too unusual here. It's worth noting that it's a good idea to ensure that clearCounter is called for each time startCounter is called (and in the same thread). We need to make sure to clear ThreadLocals to avoid counters leaking to another thread or to possibly cause memory leaks.
The last tricky part to solve is the fact that we need to reference HibernateStatisticsInterceptor from the RequestStatisticsInterceptor which means that HibernateStatisticsInterceptor needs to be Spring managed bean. Luckily, the answer for Spring Boot) can be found on StackOverflow: How to use Spring managed Hibernate interceptors in Spring Boot?
It is necessary to provide a custom LocalContainerEntityManagerFactoryBean (I love this short and concise name!) in order to inject our HibernateStatisticsInterceptor to JPA property hibernate.ejb.interceptor. We also need to register RequestStatisticsInterceptor and configure it to intercept all requests.
Here is the complete Spring Boot configuration for a simple application:
@Configuration
@EnableAutoConfiguration
@ComponentScan
public class Application {


	public static void main(String[] args) {
		start();
	}

	public static void start() {
		SpringApplication.run(Application.class);
	}

	@Bean
	public LocalContainerEntityManagerFactoryBean entityManagerFactory(
			EntityManagerFactoryBuilder factory, DataSource dataSource,
			JpaProperties properties) {
		Map<String, Object> jpaProperties = new HashMap<>();
		jpaProperties.putAll(properties.getHibernateProperties(dataSource));
		jpaProperties.put("hibernate.ejb.interceptor", hibernateInterceptor());
		return factory.dataSource(dataSource).packages("io.github.knes1.todo.model")
				.properties(jpaProperties).build();
	}

	@Bean
	public HibernateStatisticsInterceptor hibernateInterceptor() {
		return new HibernateStatisticsInterceptor();
	}

	@Configuration
	public static class WebApplicationConfig extends WebMvcConfigurerAdapter {

		@Autowired
		RequestStatisticsInterceptor requestStatisticsInterceptor;

		@Bean
		public RequestStatisticsInterceptor requestStatisticsInterceptor() {
			return new RequestStatisticsInterceptor();
		}

		@Override
		public void addInterceptors(InterceptorRegistry registry) {
			registry.addInterceptor(requestStatisticsInterceptor).addPathPatterns("/**");
		}
	}

}
If the above config doesn't work for you because you use older Spring versions, take a look at this blog post for an alternative configuration: Spring managed Hibernate interceptor in JPA
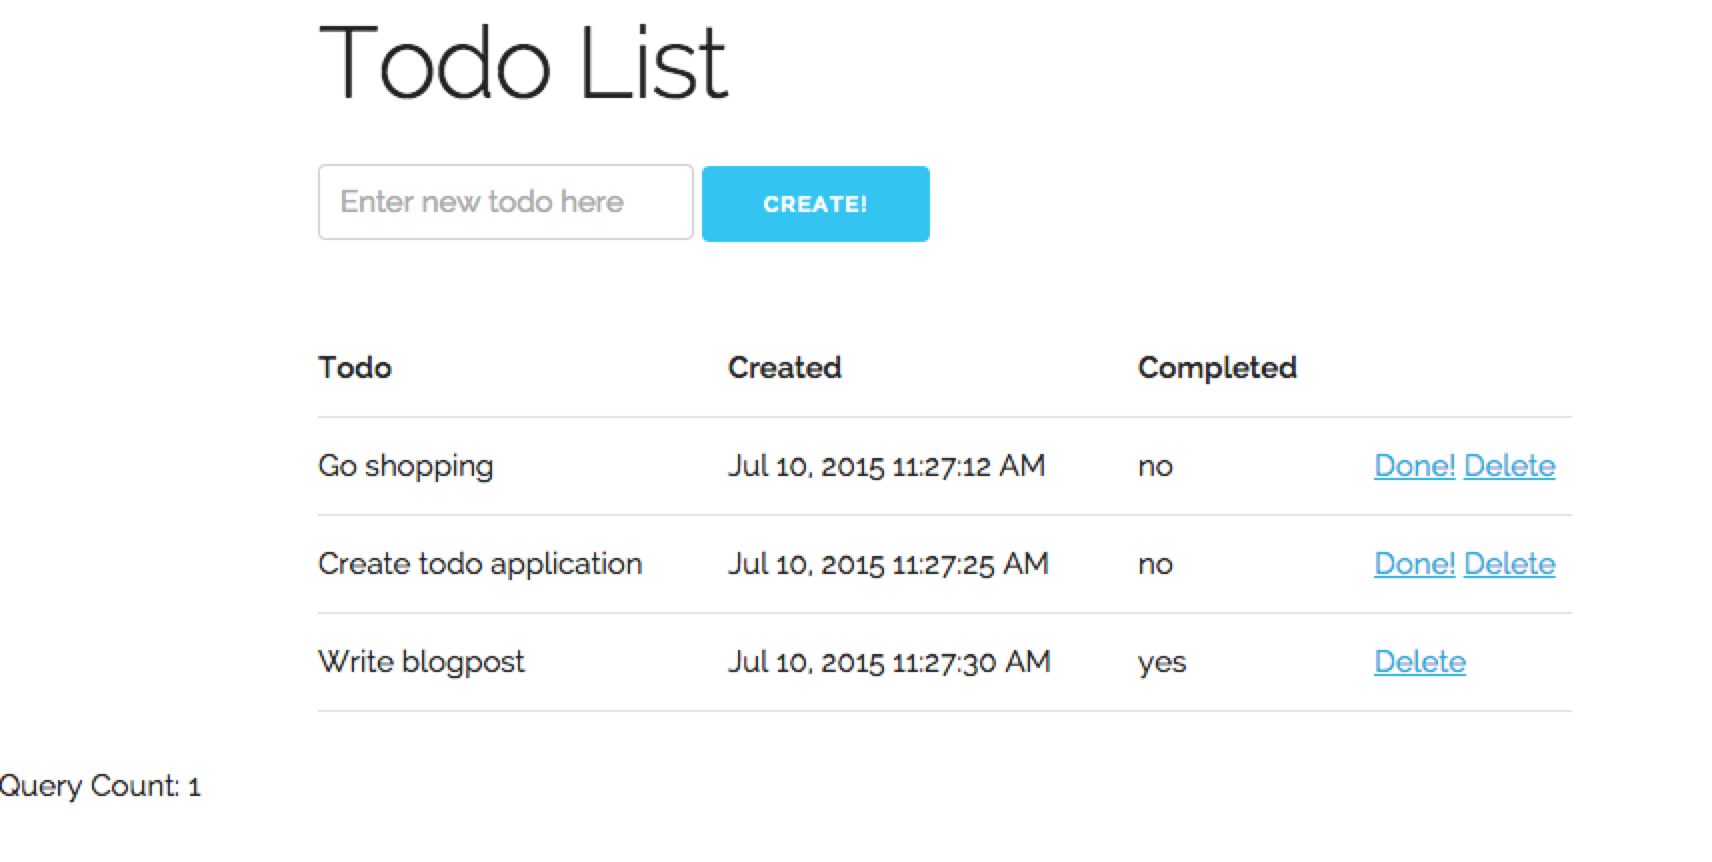
To demonstrate what we achieved, I've built a small todo list application. Source code is available on GitHub.
After running the application and creating a few todo items, here's what shows up in the log:
2015-07-10 11:26:55.707  INFO 85977 --- [qtp545373187-17] i.g.k.t.u.RequestStatisticsInterceptor   : [Time: 251 ms] [Queries: 1] GET /
2015-07-10 11:26:59.347  INFO 85977 --- [qtp545373187-19] i.g.k.t.u.RequestStatisticsInterceptor   : [Time: 166 ms] [Queries: 2] GET /todos/1/delete
2015-07-10 11:26:59.361  INFO 85977 --- [qtp545373187-16] i.g.k.t.u.RequestStatisticsInterceptor   : [Time: 7 ms] [Queries: 1] GET /
2015-07-10 11:27:12.070  INFO 85977 --- [qtp545373187-17] i.g.k.t.u.RequestStatisticsInterceptor   : [Time: 21 ms] [Queries: 1] POST /todos
2015-07-10 11:27:12.085  INFO 85977 --- [qtp545373187-18] i.g.k.t.u.RequestStatisticsInterceptor   : [Time: 9 ms] [Queries: 1] GET /
2015-07-10 11:27:25.058  INFO 85977 --- [qtp545373187-15] i.g.k.t.u.RequestStatisticsInterceptor   : [Time: 4 ms] [Queries: 1] POST /todos
2015-07-10 11:27:25.072  INFO 85977 --- [qtp545373187-19] i.g.k.t.u.RequestStatisticsInterceptor   : [Time: 9 ms] [Queries: 1] GET /
2015-07-10 11:27:30.292  INFO 85977 --- [qtp545373187-18] i.g.k.t.u.RequestStatisticsInterceptor   : [Time: 5 ms] [Queries: 1] POST /todos
2015-07-10 11:27:30.304  INFO 85977 --- [qtp545373187-15] i.g.k.t.u.RequestStatisticsInterceptor   : [Time: 8 ms] [Queries: 1] GET /
2015-07-10 11:27:32.135  INFO 85977 --- [qtp545373187-19] i.g.k.t.u.RequestStatisticsInterceptor   : [Time: 24 ms] [Queries: 2] GET /todos/4/completed
2015-07-10 11:27:32.143  INFO 85977 --- [qtp545373187-16] i.g.k.t.u.RequestStatisticsInterceptor   : [Time: 4 ms] [Queries: 1] GET /
We have timings and query counts for each request - now we can easily detect early if something went wrong because we'll see query counts suddenly increase (if we for example hit the so called N+1 problems, or if we carelessly navigate through collections). As a bonus, since we included query counts in the model, we can even print them out on the page while we do development (notice the query count for current page in the screenshot below). Here's a screenshot form the sample application:
And that's all I have for this post - I hope I've helped in keeping query generation under control!