Manage Spring Boot Logs with Elasticsearch, Logstash and Kibana
When time comes to deploy a new project, one often overlooked aspect is log management. ELK stack (Elasticsearch, Logstash, Kibana) is, among other things, a powerful and freely available log management solution. In this article I will show you how to install and setup ELK and use it with default log format of a Spring Boot application.
For this guide, I've setup a demo Spring Boot application with logging enabled and with Logstash configuration that will send log entries to Elasticsearch. Demo application is a simple todo list available here.

Application will store logs into a log file. Logstash will read and parse the log file and ship log entries to an Elasticsearch instance. Finally, we will use Kibana 4 (Elasticsearch web frontend) to search and analyze the logs.
Step 1) Install Elasticsearch
- Download elasticsearch zip file from https://www.elastic.co/downloads/elasticsearch
- Extract it to a directory (unzip it)
- Run it (
bin/elasticsearchorbin/elasticsearch.baton Windows) - Check that it runs using
curl -XGET http://localhost:9200
Here's how to do it (steps are written for OS X but should be similar on other systems):
wget https://download.elastic.co/elasticsearch/elasticsearch/elasticsearch-1.7.1.zip
unzip elasticsearch-1.7.1.zip
cd elasticsearch-1.7.1
bin/elasticsearch
Elasticsearch should be running now. You can verify it's running using curl. In a separate terminal window execute a GET request to Elasticsearch's status page:
curl -XGET http://localhost:9200
If all is well, you should get the following result:
{
  "status" : 200,
  "name" : "Tartarus",
  "cluster_name" : "elasticsearch",
  "version" : {
    "number" : "1.7.1",
    "build_hash" : "b88f43fc40b0bcd7f173a1f9ee2e97816de80b19",
    "build_timestamp" : "2015-07-29T09:54:16Z",
    "build_snapshot" : false,
    "lucene_version" : "4.10.4"
  },
  "tagline" : "You Know, for Search"
}
Step 2) Install Kibana 4
- Download Kibana archive from https://www.elastic.co/downloads/kibana
- Please note that you need to download appropriate distribution for your OS, URL given in examples below is for OS X
- Extract the archive
- Run it (
bin/kibana) - Check that it runs by pointing the browser to the Kibana's WebUI
Here's how to do it:
wget https://download.elastic.co/kibana/kibana/kibana-4.1.1-darwin-x64.tar.gz
tar xvzf kibana-4.1.1-darwin-x64.tar.gz
cd kibana-4.1.1-darwin-x64
bin/kibana
Point your browser to http://localhost:5601 (if Kibana page shows up, we're good - we'll configure it later)
Step 3) Install Logstash
- Download Logstash zip from https://www.elastic.co/downloads/logstash
- Extract it (unzip it)
wget https://download.elastic.co/logstash/logstash/logstash-1.5.3.zip
unzip logstash-1.5.3.zip
Step 4) Configure Spring Boot's Log File
In order to have Logstash ship log files to Elasticsearch, we must first configure Spring Boot to store log entries into a file. We will establish the following pipeline: Spring Boot App → Log File → Logstash → Elasticsearch. There are other ways of accomplishing the same thing, such as configuring logback to use TCP appender to send logs to a remote Logstash instance via TCP, and many other configurations. I prefer the file approach because it's simple, unobtrusive (you can easily add it to existing systems) and nothing will be lost/broken if for some reason Logstash stops working or if Elasticsearch dies.
Anyhow, let's configure Spring Boot's log file. The simplest way to do this is to configure log file name in application.properties. It's enough to add the following line:
logging.file=application.log
Spring Boot will now log ERROR, WARN and INFO level messages in the application.log log file and will also rotate it as it reaches 10 Mb.
Step 5) Configure Logstash to Understand Spring Boot's Log File Format
Now comes the tricky part. We need to create Logstash config file. Typical Logstash config file consists of three main sections: input, filter and output. Each section contains plugins that do relevant part of the processing (such as file input plugin that reads log events from a file or elasticsearch output plugin which sends log events to Elasticsearch).

Input section defines from where Logstash will read input data - in our case it will be a file hence we will use a file plugin with multiline codec, which basically means that our input file may have multiple lines per log entry.
Input Section
Here's the input section:
input {
  file {
    type => "java"
    path => "/path/to/application.log"
    codec => multiline {
      pattern => "^%{YEAR}-%{MONTHNUM}-%{MONTHDAY} %{TIME}.*"
      negate => "true"
      what => "previous"
    }
  }
}
- We're using
fileplugin. typeis set tojava- it's just additional piece of metadata in case you will use multiple types of log files in the future.pathis the absolute path to the log file. It must be absolute - Logstash is picky about this.- We're using
multilinecodecwhich means that multiple lines may correspond to a single log event, - In order to detect lines that should logically be grouped with a previous line we use a detection pattern:
pattern => "^%{YEAR}-%{MONTHNUM}-%{MONTHDAY} %{TIME}.*"→ Each new log event needs to start with date.negate => "true"→ if it doesn't start with a date ...what => "previous"→ ... then it should be grouped with a previous line.
File input plugin, as configured, will tail the log file (e.g. only read new entries at the end of the file). Therefore, when testing, in order for Logstash to read something you will need to generate new log entries.
Filter Section
Filter section contains plugins that perform intermediary processing on an a log event. In our case, event will either be a single log line or multiline log event grouped according to the rules described above. In the filter section we will do several things:
- Tag a log event if it contains a stacktrace. This will be useful when searching for exceptions later on.
- Parse out (or grok, in logstash terminology) timestamp, log level, pid, thread, class name (logger actually) and log message.
- Specified timestamp field and format - Kibana will use that later for time based searches.
Filter section for Spring Boot's log format that aforementioned things looks like this:
filter {
  #If log line contains tab character followed by 'at' then we will tag that entry as stacktrace
  if [message] =~ "\tat" {
    grok {
      match => ["message", "^(\tat)"]
      add_tag => ["stacktrace"]
    }
  }

  #Grokking Spring Boot's default log format
  grok {
    match => [ "message",
               "(?<timestamp>%{YEAR}-%{MONTHNUM}-%{MONTHDAY} %{TIME})  %{LOGLEVEL:level} %{NUMBER:pid} --- \[(?<thread>[A-Za-z0-9-]+)\] [A-Za-z0-9.]*\.(?<class>[A-Za-z0-9#_]+)\s*:\s+(?<logmessage>.*)",
               "message",
               "(?<timestamp>%{YEAR}-%{MONTHNUM}-%{MONTHDAY} %{TIME})  %{LOGLEVEL:level} %{NUMBER:pid} --- .+? :\s+(?<logmessage>.*)"
             ]
  }

  #Parsing out timestamps which are in timestamp field thanks to previous grok section
  date {
    match => [ "timestamp" , "yyyy-MM-dd HH:mm:ss.SSS" ]
  }
}
Explanation:
if [message] =~ "\tat"→ If message containstabcharacter followed byat(this is ruby syntax) then...- ... use the
grokplugin to tag stacktraces:match => ["message", "^(\tat)"]→ whenmessagematches beginning of the line followed bytabfollowed byatthen...add_tag => ["stacktrace"]→ ... tag the event withstacktracetag.
- Use the
grokplugin for regular Spring Boot log message parsing:- First pattern extracts timestamp, level, pid, thread, class name (this is actually logger name) and the log message.
- Unfortunately, some log messages don't have logger name that resembles a class name (for example, Tomcat logs) hence the second pattern that will skip the logger/class field and parse out timestamp, level, pid, thread and the log message.
- Use
dateplugin to parse and set the event date:match => [ "timestamp" , "yyyy-MM-dd HH:mm:ss.SSS" ]→timestampfield (grokked earlier) contains the timestamp in the specified format
Output Section
Output section contains output plugins that send event data to a particular destination. Outputs are the final stage in the event pipeline. We will be sending our log events to stdout (console output, for debugging) and to Elasticsearch.
Compared to filter section, output section is rather straightforward:
output {
  # Print each event to stdout, useful for debugging. Should be commented out in production.
  # Enabling 'rubydebug' codec on the stdout output will make logstash
  # pretty-print the entire event as something similar to a JSON representation.
  stdout {
    codec => rubydebug
  }

  # Sending properly parsed log events to elasticsearch
  elasticsearch {
    host => "127.0.0.1"
  }
}
Explanation:
- We are using multiple outputs:
stdoutandelasticsearch. stdout { ... }→stdoutplugin prints log events to standard output (console).codec => rubydebug→ Pretty print events using JSON-like format
elasticsearch { ... }→elasticsearchplugin sends log events to Elasticsearch server.host => "127.0.0.1"→ Hostname where Elasticsearch is located - in our case, localhost.
Update 5/9/2016: At the time of writing this update, the latest versions of Logstash's elasticsearch output plugin uses
hostsconfiguration parameter instead ofhostwhich is shown in example above. New parameter takes an array of hosts (e.g. elasticsearch cluster) as value. In other words, if you are using the latest Logstash version, configure elasticsearch output plugin as follows:elasticsearch { hosts => ["127.0.0.1"] }
Putting it all together
Finally, the three parts - input, filter and output - need to be copy pasted together and saved into logstash.conf config file. Once the config file is in place and Elasticsearch is running, we can run Logstash:
/path/to/logstash/bin/logstash -f logstash.conf
If everything went well, Logstash is now shipping log events to Elasticsearch.
Step 6) Configure Kibana
Ok, now it's time to visit the Kibana web UI again. We have started it in step 2 and it should be running at http://localhost:5601.
First, you need to point Kibana to Elasticsearch index(s) of your choice. Logstash creates indices with the name pattern of logstash-YYYY.MM.DD. In Kibana Settings → Indices configure the indices:
- Index contains time-based events (select this option)
- Use event times to create index names (select this option)
- Index pattern interval: Daily
- Index name or pattern: [logstash-]YYYY.MM.DD
- Click on "Create Index"
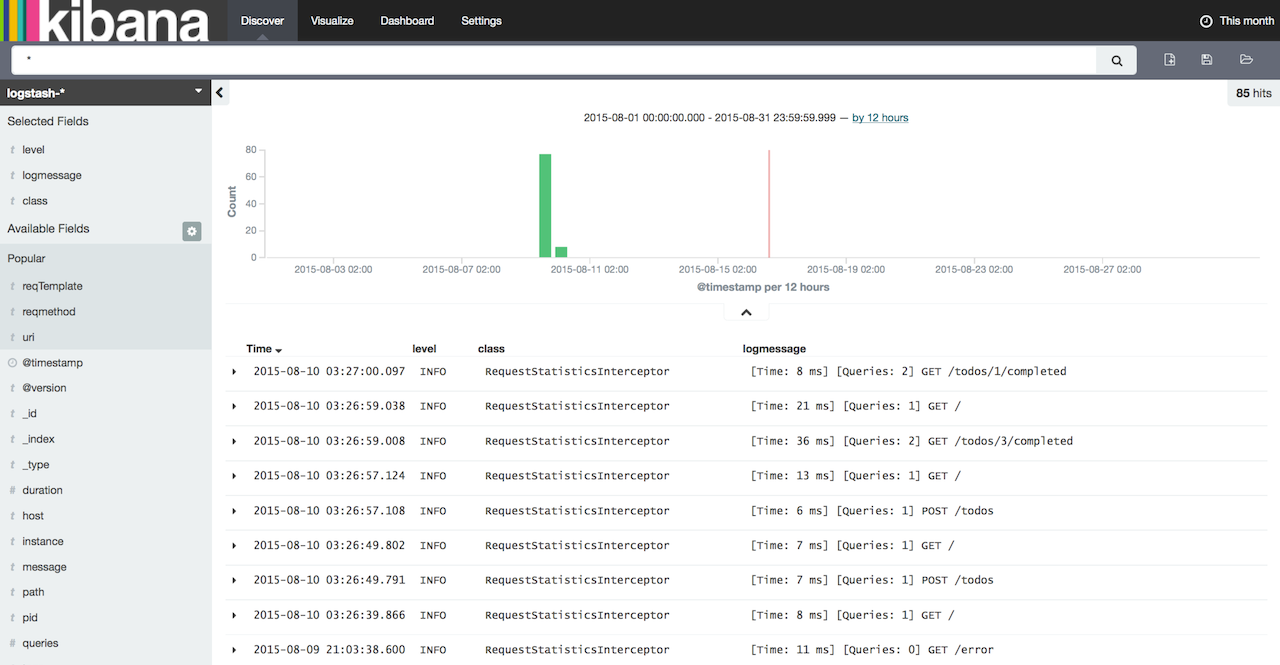
Now click on "Discover" tab. In my opinion, "Discover" tab is really named incorrectly in Kibana - it should be labeled as "Search" instead of "Discover" because it allows you to perform new searches and also to save/manage them. Log events should be showing up now in the main window. If they're not, then double check the time period filter in to right corner of the screen. Default table will have 2 columns by default: Time and _source. In order to make the listing more useful, we can configure the displayed columns. From the menu on the left select level, class and logmessage.
Alright! You're now ready to take control of your logs using ELK stack and start customizing and tweaking your log management configuration. You can download the sample application used when writing this article from here: https://github.com/knes1/todo. It's already configured to write logs in a file and has the Logstash config as described above (although absolute paths will need to be tweaked in logstash.conf).
If you would like to search or follow your EL logs from command line, checkout Elktail - a command line utility I've created for accessing and tailng logs stored in EL.
As always, let me know if you have any question/comments or ideas in the comments section below.